Diversification: U.S. Stocks – Large vs. Small
In the midst of the current market turbulence, many of our clients are paying more attention to financial markets and their investment portfolios than they otherwise typically might. Rather than allowing headlines to influence our emotions, at PDS Planning we rely upon longer-term data and historical context to put the current environment into perspective and allow us to make more informed decisions.
In light of clients’ rekindled interest and heightened awareness, we thought it would be helpful to review some investing basics through the lens of our time-tested belief that “today’s headlines and tomorrow’s reality are seldom the same.” By sharing our objective outlook, we hope to alleviate some of our clients’ short-term emotional anxiety while achieving better long-term financial results for them. Be sure to read our previous “Diversification: Stocks & Bonds” and “Diversification: U.S. vs. International Stocks” posts for more information.
“Large Cap” refers to a company with a market capitalization of more than $10 billion. Common indices used to track U.S. Large Cap stock performance are the S&P 500 and Russell 1000. U.S. Large Cap stocks represent over 90% of the total market value of U.S. equities as measured by the Wilshire 5000 Total Market Index.
“Small Cap” refers to a company with a market capitalization between $300 million and $2 billion. Common indices used to track U.S. Small Cap stock performance are the Russell 2000 and S&P 600. U.S. Small Cap stocks represent under 10% of the total market value of U.S. equities as measured by the Wilshire 5000 Total Market Index.
Risk & Reward
A generally accepted principle of investing is the “Risk-Return Tradeoff”: potential return rises with an increase in risk. In the case of Small cap stocks vs Large cap stocks, compared to larger companies, smaller companies carry more risk and, therefore, have the potential to outperform in the long-term. Larger companies tend to have a more secure client base, positive cash flow, and reliable earnings making the swings in market price usually less drastic than smaller companies.
Large vs. Small: 15 Years
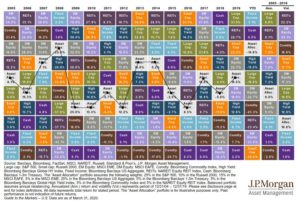
You can see in the chart below from JPMorgan the year by year returns of different asset classes along with the volatility of each to the far right. Over the last 15 years, the “Risk-Return Tradeoff” for small caps versus large caps has not resulted in desired relative outperformance. Small caps have had higher volatility (large price swings up and down) and under-performed compared to large cap stocks. The annual return of large cap (green box) has been 9% while small caps (orange box) have posted annual returns of 7.9%.

Large vs. Small: 20 Years
What have you done for me lately? “Small caps have had a lower annual return and been more volatile since 2005, so why would they be in any portfolio?”
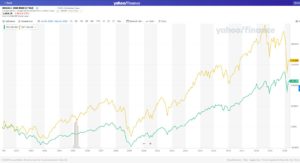
Over longer periods of time, the diversification benefits become apparent. If the investment timeline is expanded just a few more years and we analyze the returns from 2000 through today, a different story is told. Using the Russell 1000 index (^RUI, green line) for large cap returns and the Russell 2000 index (^RUT, orange line) for small cap returns, the chart below shows that small caps have significantly outperformed large caps over the last 20 years, 160% to 110%, or a +50% higher return.

Time & Diversification
Over shorter periods of time, asset class returns can vary widely; however, long-term investors are typically rewarded for thoughtful portfolio diversification. Small cap stocks and large cap stocks behave differently in different economic and market situations. There are periods of small cap outperformance and periods of large cap outperformance. Unfortunately, there’s no crystal ball to know when one will outperform the other (if you know of a way, give us a call). It is important to maintain a diversified portfolio for the opportunity to take advantage of all asset class returns. Maintaining a diversified allocation that is consistent with your long-term goals, combined with periodic rebalancing, has consistently resulted in beneficial long-term financial outcomes.
PDS Planning continues to be available to both our existing clients and prospective clients who can benefit from the financial planning and investment management services we provide. Please contact us if you have any questions or would like to discuss ways we may be able to assist you in providing clarity during these uncertain times.
Please remember that past performance may not be indicative of future results. Different types of investments involve varying degrees of risk, and there can be no assurance that any specific investment, strategy, or product or any non-investment related content, made reference to directly or indirectly in this newsletter, will be suitable for your individual situation, or prove successful. This material is distributed by PDS Planning, Inc. and is for information purposes only. Although information has been obtained from and is based upon sources PDS Planning believes to be reliable, we do not guarantee its accuracy. It is provided with the understanding that no fiduciary relationship exists because of this report. Opinions expressed in this report are not necessarily the opinions of PDS Planning and are subject to change without notice. PDS Planning assumes no liability for the interpretation or use of this report. Consultation with a qualified investment advisor is recommended prior to executing any investment strategy. No portion of this publication should be construed as legal or accounting advice. If you are a client of PDS Planning, please remember to contact PDS Planning, Inc., in writing, if there are any changes in your personal/financial situation or investment objectives. All rights reserved.
