
S&P 500 Dominated by Tech Mega Caps
Tech Mega Cap stocks have been propelling the markets closer and closer to all-time highs. As we mentioned in our July Viewpoints post:
- Tech Mega Caps: FAANGM stocks (Facebook, Amazon, Apple, Netflix, Google (Alphabet), and Microsoft) currently represent 24% of the S&P 500’s market capitalization, more than double the 10% they accounted for just 5 years ago in 2015. Since 2013, FAANGM stocks have returned a cumulative 442.8%. The S&P 500, excluding these stocks, has returned 71.8%, 371% less. In 2015, FAANGM stocks’ Forward P/E was ~20. Currently, their forward P/E is 39.1, nearly double. (Source: Yardeni Research)
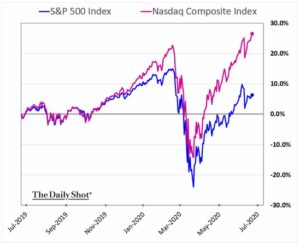
To put this in a shorter-term perspective, below is a chart from the Wall Street Journal comparing the returns of the Nasdaq Composite Index to the S&P 500 Index over the last 12 months. Notice the outperformance of the tech focused Nasdaq beginning year end 2019 and the explosive recovery after the index’s mid-March low’s.
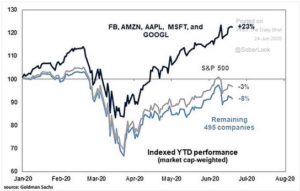
From our Viewpoints commentary, notice the disparity between the year-to-date return of Facebook, Amazon, Apple, Microsoft, and Alphabet (Google) compared to the S&P 500; a 23% gain vs a 3% loss for the total index.
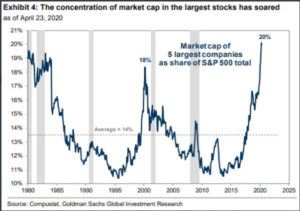
While these FAANGM stocks continue to grow, their share of the total S&P 500 index has also been increasing. The S&P 500 Index is market-cap weighted, meaning the largest company makes up the largest portion of the index. Since 1980, the 5 largest companies within the index have accounted for an average of 14% of the total capitalization. As of April 23, 2020, the 5 largest companies now account for 20% of the entire index, the most concentrated the index has been in its 5 largest holdings since the tech bubble in 1999.
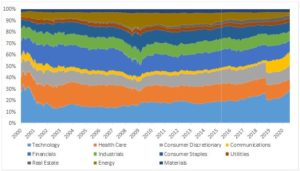
Looking at the entire index as a whole, nearly 28% of the S&P 500 is comprised of Tech, the highest since 2000.
What does this mean?
Now more than ever, we are conscious and always monitoring the risks associated with investing in the standard, market-cap weighted S&P 500 index. With more than 20% in just 5 companies, there becomes increased single company risk exposure. This is why we have been, and continue to stress the importance of diversification. It’s not enough anymore to simply own the S&P 500 index. To get the potential benefits of proper diversification, a portfolio may be supplemented with mid cap and small cap exposures, international equities, and fixed income, both domestic and global/international, to adequately spread the risk away from those top S&P companies. By doing so, the portfolio will continue to benefit from any continued growth in the mega tech stocks and may be better protected should they falter.
Please remember that past performance may not be indicative of future results. Different types of investments involve varying degrees of risk, and there can be no assurance that any specific investment, strategy, or product or any non-investment related content, made reference to directly or indirectly in this newsletter, will be suitable for your individual situation, or prove successful. This material is distributed by PDS Planning, Inc. and is for information purposes only. Although information has been obtained from and is based upon sources PDS Planning believes to be reliable, we do not guarantee its accuracy. It is provided with the understanding that no fiduciary relationship exists because of this report. Opinions expressed in this report are not necessarily the opinions of PDS Planning and are subject to change without notice. PDS Planning assumes no liability for the interpretation or use of this report. Consultation with a qualified investment advisor is recommended prior to executing any investment strategy. No portion of this publication should be construed as legal or accounting advice. If you are a client of PDS Planning, please remember to contact PDS Planning, Inc., in writing, if there are any changes in your personal/financial situation or investment objectives. All rights reserved.