June 2019 Financial Markets Summary
May was a tough month for global markets as investors grappled with tariff concerns, slowing global growth and an inverted yield curve. Domestic stocks fell by 6-8% during the month but were still up 8-10% year-to-Date (YTD) as of May 31st.
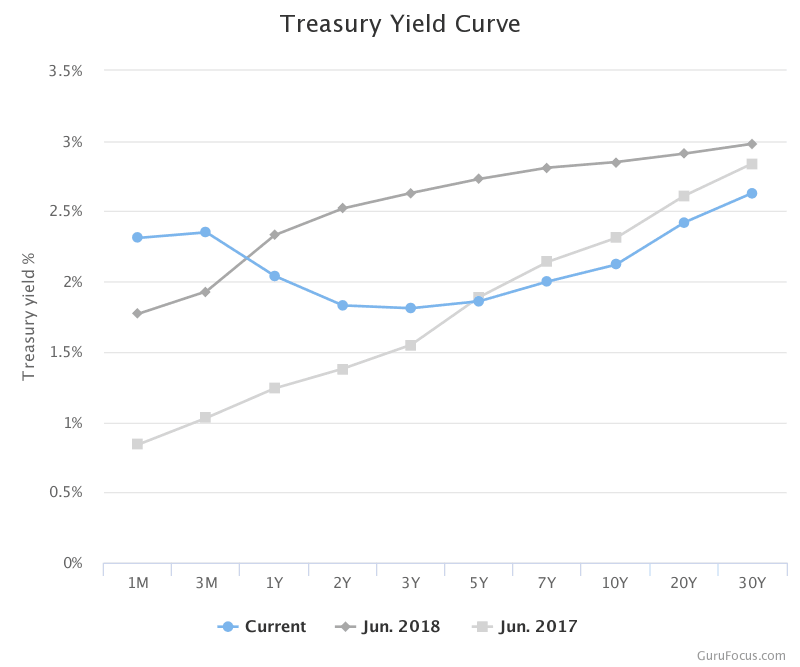
The bond market has been signaling some concern. Traditionally, the yield curve is upward sloping which means yields for long-term bonds are higher than those for short-term bonds. This curve constantly changes to reflect expectations about the economy, interest rates and inflation. However, the yield curve is now inverted where the 1-Year Treasury is actually higher than the 10-Year Treasury. This infrequent inversion has been a fairly accurate predictor of recessions. In fact, the yield curve has inverted before every recession since 1955.
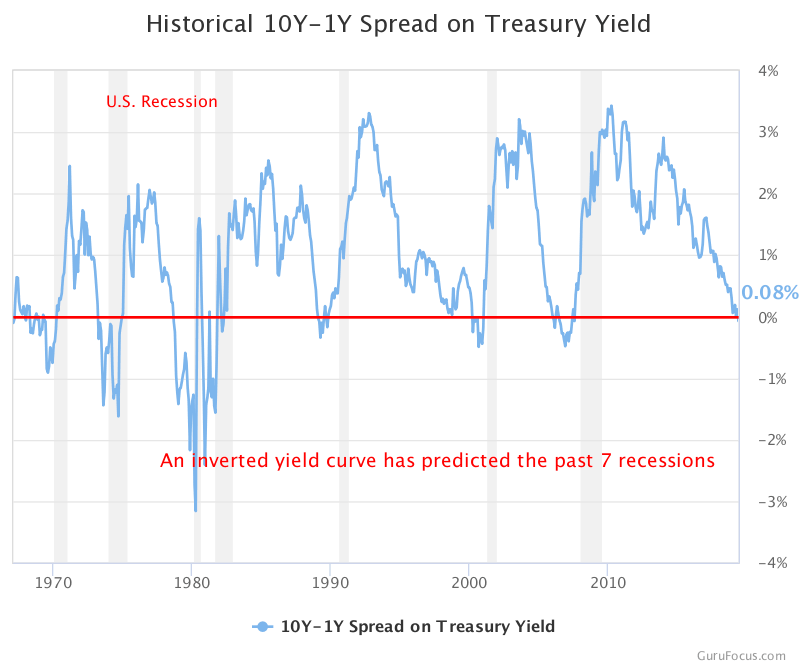
However, this doesn’t mean investors should be running for the exits. Not every yield curve inversion is followed by a recession. And for those that eventually result in a recession, the delay between the yield curve inversion and the start of a recession has ranged from 6-24 months. This is just another signal that we may be in the 7th or 8th inning of the game or in the later stages of the economic cycle.
Trade continues to impact markets around the world. In fact, this seems to be the main driver of the volatility we experienced in May. Trade talks have broken down with China, but both sides have a vested interest to make a deal. If progress is made with China, Mexico and the U.S. at the G20 summit, then we could see markets react positively. However, if talks fall through, we would expect more volatility in the months ahead.
We remind clients to keep their next 5-8 years of income needs from the portfolio in stable assets such as cash, CDs and short-term bonds. Please keep in mind our time-tested belief that “today’s headlines and tomorrow’s reality are seldom the same.”
| Asset Index Category | Category | Category | 5-Year | 10-Year |
| 3 Months | 2019 YTD | Average | Average | |
| S&P 500 Index – Large Companies | -1.2% | 9.8% | 7.4% | 11.6% |
| S&P 400 Index – Mid-Size Companies | -5.2% | 8.9% | 5.6% | 12.1% |
| Russell 2000 Index – Small Companies | -7.0% | 8.7% | 5.2% | 11.3% |
| MSCI ACWI – Global (U.S. & Intl. Stocks) | -1.9% | 9.0% | 6.9% | 9.6% |
| MSCI EAFE Index – Developed Intl. | -1.5% | 7.6% | 1.3% | 6.2% |
| MSCI EM Index – Emerging Markets | -4.5% | 4.1% | 1.8% | 5.0% |
| Short-Term Corporate Bonds | 1.6% | 2.6% | 1.5% | 2.5% |
| Multi-Sector Bonds | 3.7% | 4.8% | 2.7% | 3.8% |
| International Government Bonds | 1.9% | 2.3% | 0.0% | 1.7% |
| Bloomberg Commodity Index | -3.9% | 2.3% | -9.5% | -4.2% |
| Dow Jones U.S. Real Estate | 4.1% | 17.0% | 5.1% | 14.8% |
Please remember that past performance may not be indicative of future results. Different types of investments involve varying degrees of risk, and there can be no assurance that any specific investment, strategy, or product or any non-investment related content, made reference to directly or indirectly in this newsletter, will be suitable for your individual situation, or prove successful. This material is distributed by PDS Planning, Inc. and is for information purposes only. Although information has been obtained from and is based upon sources PDS Planning believes to be reliable, we do not guarantee its accuracy. It is provided with the understanding that no fiduciary relationship exists because of this report. Opinions expressed in this report are not necessarily the opinions of PDS Planning and are subject to change without notice. PDS Planning assumes no liability for the interpretation or use of this report. Consultation with a qualified investment advisor is recommended prior to executing any investment strategy. No portion of this publication should be construed as legal or accounting advice. If you are a client of PDS Planning, please remember to contact PDS Planning, Inc., in writing, if there are any changes in your personal/financial situation or investment objectives. All rights reserved.


