February 2020 Financial Markets Summary
The month of January ended on a sour note with the global stock markets pulling back from their highs by 3%-4% within the last week. Much of this was due to growing concerns around the rapidly spreading coronavirus and its potential global economic impact.
Vanguard suggests that China’s prompt and internationally coordinated response may offer some reassurance that the human and economic effects can be limited. Nevertheless, experts expect Chinese growth to slow for at least the first quarter until the coronavirus has been contained.
“Outside of China, the biggest economic impact is expected to be in Thailand, which relies heavily on Chinese tourism,” suggests Stephen Green, a Capital Group economist. “Among industries, travel and tourism throughout Asia will likely take a significant hit, along with sales of luxury goods. Energy stocks have also taken a hit as investors expect oil prices to decline further amid lower demand from China.”
From the U.S. perspective, economic fundamentals remain sound, labor markets are resilient and the Federal Reserve stands ready to take action as needed. “The coronavirus looks to be a modest, but temporary restraint on U.S. economic activity via secondary channels of impact, but should not derail growth expectations for 2020.” The S&P 500 has already regained the late January losses within the first few trading days of February.
We expect a higher amount of volatility in the next few months due the coronavirus concerns, slowing global growth and the election cycle. Dating back to 1932, election years have averaged a higher amount of volatility during the primary season from January to May. Much of this is due to the uncertainty until the candidates have ultimately been decided.
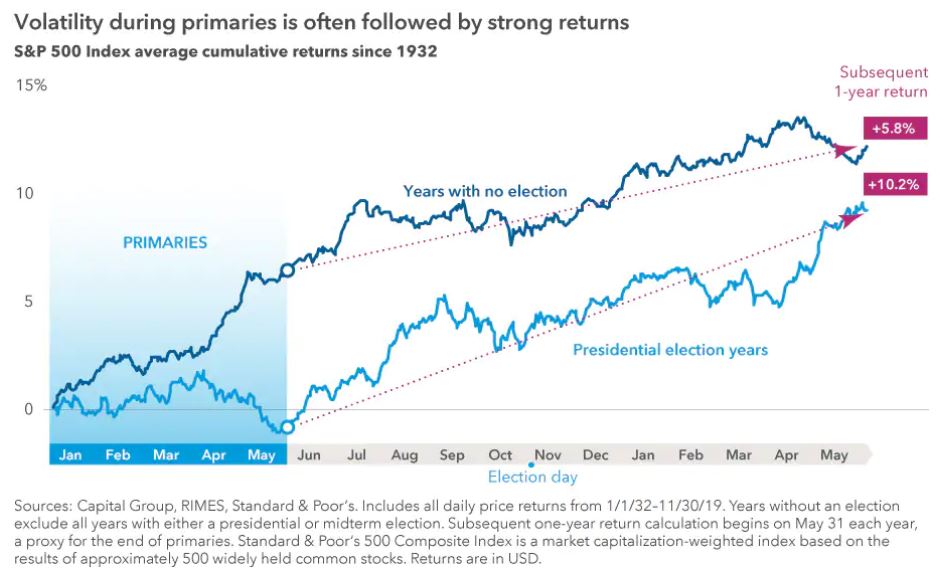
Even with this election season, Vanguard reminds us that “financial markets are incredibly complex systems influenced by many different variable, including valuations, economic conditions and investor sentiment. Political developments are just one of them.”
| Asset Index Category | Category | Category | 5-Year | 10-Year |
| 3 Months | 2020 YTD | Average | Average | |
| S&P 500 Index – Large Companies | 6.2% | -0.2% | 10.1% | 11.6% |
| S&P 400 Index – Mid-Size Companies | 2.7% | -2.7% | 6.9% | 11.1% |
| Russell 2000 Index – Small Companies | 3.3% | -3.2% | 6.7% | 10.4% |
| MSCI ACWI – Global (U.S. & Intl. Stocks) | 4.7% | -1.3% | 8.4% | 9.2% |
| MSCI EAFE Index – Developed Intl. | 2.2% | -2.1% | 5.1% | 5.8% |
| MSCI EM Index – Emerging Markets | 2.3% | -4.7% | 4.5% | 3.8% |
| Short-Term Corporate Bonds | 1.0% | 0.7% | 2.0% | 2.1% |
| Multi-Sector Bonds | 1.8% | 1.9% | 3.0% | 3.8% |
| International Government Bonds | 0.1% | -1.3% | 2.3% | 1.2% |
| Bloomberg Commodity Index | -5.8% | -7.4% | -4.7% | -4.7% |
| Dow Jones U.S. Real Estate | 1.4% | 1.5% | 7.5% | 12.7% |
Please remember that past performance may not be indicative of future results. Different types of investments involve varying degrees of risk, and there can be no assurance that any specific investment, strategy, or product or any non-investment related content, made reference to directly or indirectly in this newsletter, will be suitable for your individual situation, or prove successful. This material is distributed by PDS Planning, Inc. and is for information purposes only. Although information has been obtained from and is based upon sources PDS Planning believes to be reliable, we do not guarantee its accuracy. It is provided with the understanding that no fiduciary relationship exists because of this report. Opinions expressed in this report are not necessarily the opinions of PDS Planning and are subject to change without notice. PDS Planning assumes no liability for the interpretation or use of this report. Consultation with a qualified investment advisor is recommended prior to executing any investment strategy. No portion of this publication should be construed as legal or accounting advice. If you are a client of PDS Planning, please remember to contact PDS Planning, Inc., in writing, if there are any changes in your personal/financial situation or investment objectives. All rights reserved.


