
It’s officially back to school season! Whether you’re excited for school, sad the summer is over, or can’t decide what to feel, it’s okay – the stock market and the economy can’t quite decide either. Is the comparison a bit of a stretch? Sure. But yes, the market and economy have continued moving in opposite directions. The economy shows most signs pointing to a recession while markets defy gravity and carry on nearing all time highs.
The chart below provides an easy to visualize representation of the different economic indicators we’ve mentioned in previous posts. There are still several positive indicators, but yellow, orange, and red are outnumbering the green. Additionally, compared to last year none of the categories have improved. They have either stayed the same or got worse.
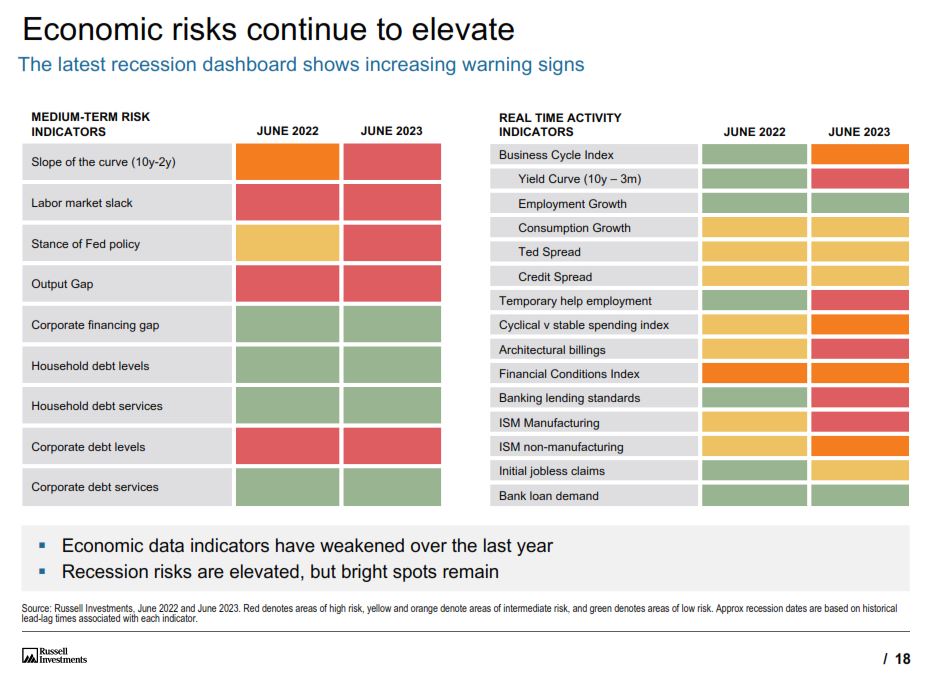
The first of the medium-term indicators on the left side, slope of the curve, is one that’s gotten worse since last June. This has been a point of concern for many when discussing the economy. Prior to each recession (grey bar) the spread between the 10-year Treasury yield and the 2 year Treasury yield has dipped to negative territory. The time between the spread dipping into negative territory and a recession beginning varies, but it’s happened in each case shown on the chart below, dating back to 1976.
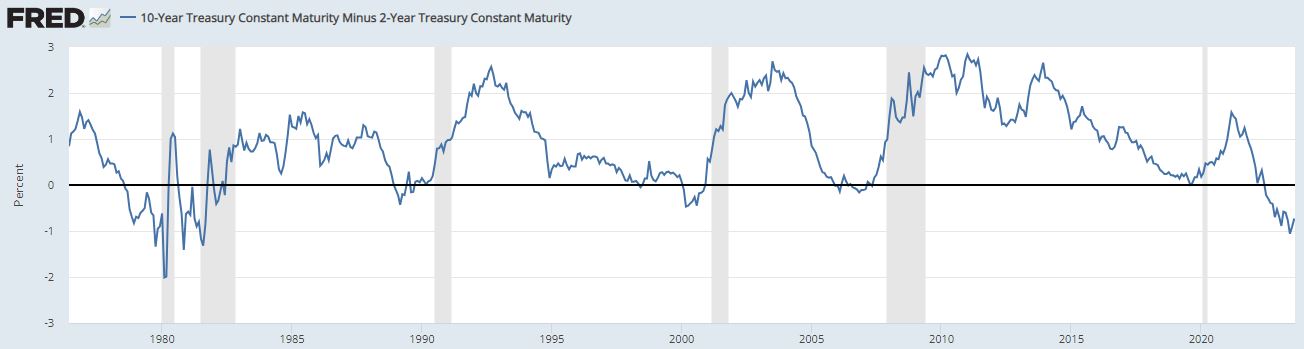
In most cases, the longer dated treasury will offer a higher yield to compensate for the length of the investment. The longer an investor has until maturity, the more risk it carries. When the normally longer dated securities are yielding less than the shorter dated securities, it tells us investors are pessimistic about the economy. Investors purchase the longer-term holdings over the short-term and, to compete, the short-term holdings increase yield to attract investors. Investors are effectively locking in a perceived ‘good’ long-term rate with the thought that a looming recession will knock rates, especially long-term rates, much lower.
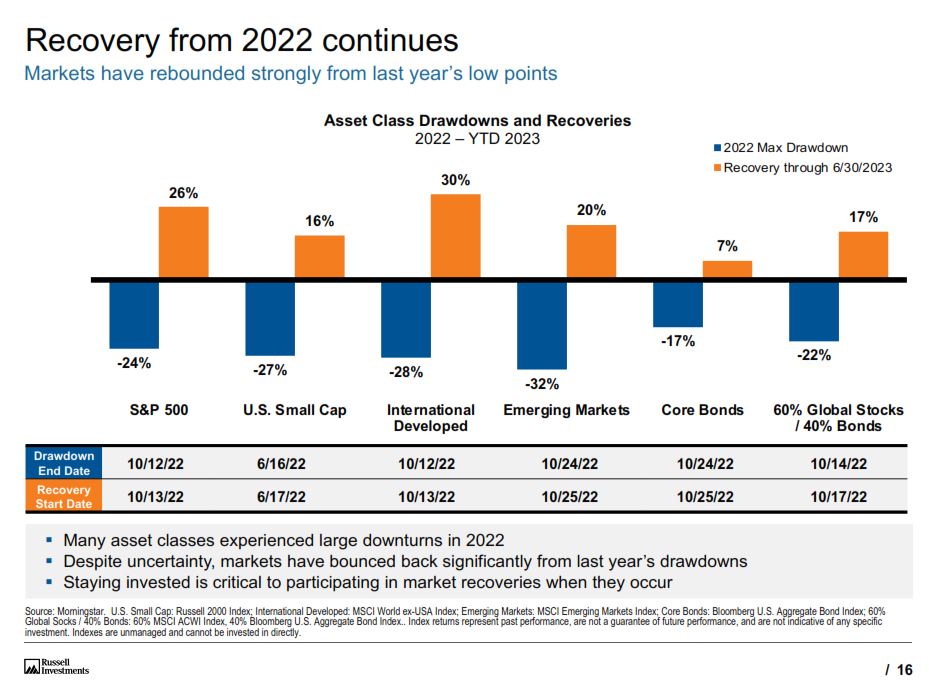
The markets, on the other hand, are looking much more positive. The chart below looks at the asset class recoveries since their low points in 2022. As Russell Investments points out in the chart “despite uncertainty, markets have bounced back significantly from last year’s drawdowns.” They go on to say, “staying invested is critical to participating in market recoveries when they occur.” At PDS Planning, we stress the importance of a diversified portfolio of US and International stocks and bonds coupled with strategically rebalancing when one area becomes out of balance from the target. Over shorter periods of time, asset class returns can vary widely; however, long-term investors are typically rewarded for thoughtful portfolio diversification.
Looking at historical market data, it’s possible the recovery continues. BlackRock took the average return for July through December for every year since 1926 and categorized it to show the return after a positive 6 months and the return after a negative 6 months. While both are positive [right side of the chart] the markets tend to do better after a first half of positive momentum.
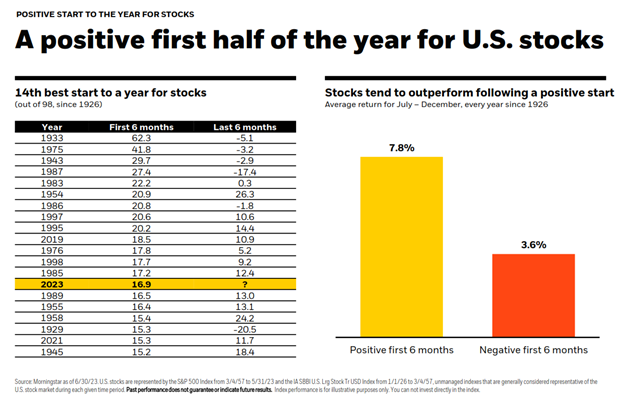
The data on the left side of the chart shows a positive return is not always the case. PDS will continue to monitor investment markets and the economy, and we hope the start of the school year for students and faculty goes as smooth as possible!
IMPORTANT DISCLOSURE INFORMATION: Please remember that past performance is no guarantee of future results. Different types of investments involve varying degrees of risk, and there can be no assurance that the future performance of any specific investment, investment strategy, or product (including the investments and/or investment strategies recommended or undertaken by PDS Planning, Inc. [“PDS”]), or any non-investment related content, made reference to directly or indirectly in this blog will be profitable, equal any corresponding indicated historical performance level(s), be suitable for your portfolio or individual situation, or prove successful. Due to various factors, including changing market conditions and/or applicable laws, the content may no longer be reflective of current opinions or positions. Moreover, you should not assume that any discussion or information contained in this blog serves as the receipt of, or as a substitute for, personalized investment advice from PDS. To the extent that a reader has any questions regarding the applicability of any specific issue discussed above to his/her individual situation, he/she is encouraged to consult with the professional advisor of his/her choosing. PDS is neither a law firm nor a certified public accounting firm and no portion of the blog content should be construed as legal or accounting advice. A copy of the PDS’ current written disclosure Brochure discussing our advisory services and fees is available for review upon request or at www.pdsplanning.com. Please Note: PDS does not make any representations or warranties as to the accuracy, timeliness, suitability, completeness, or relevance of any information prepared by any unaffiliated third party, whether linked to PDS’ web site or blog or incorporated herein, and takes no responsibility for any such content. All such information is provided solely for convenience purposes only and all users thereof should be guided accordingly. Please Remember: If you are a PDS client, please contact PDS, in writing, if there are any changes in your personal/financial situation or investment objectives for the purpose of reviewing/evaluating/revising our previous recommendations and/or services, or if you would like to impose, add, or to modify any reasonable restrictions to our investment advisory services. Unless, and until, you notify us, in writing, to the contrary, we shall continue to provide services as we do currently. Please Also Remember to advise us if you have not been receiving account statements (at least quarterly) from the account custodian.