

Welcome to our September 2026 Viewpoints, a monthly bulletin from PDS Planning to our valued clients and friends. Our goal with each issue of Viewpoints is to provide you with a wide variety of perspectives on life and wealth. Feel free to share with others.
Treasury Yields Continue Increasing
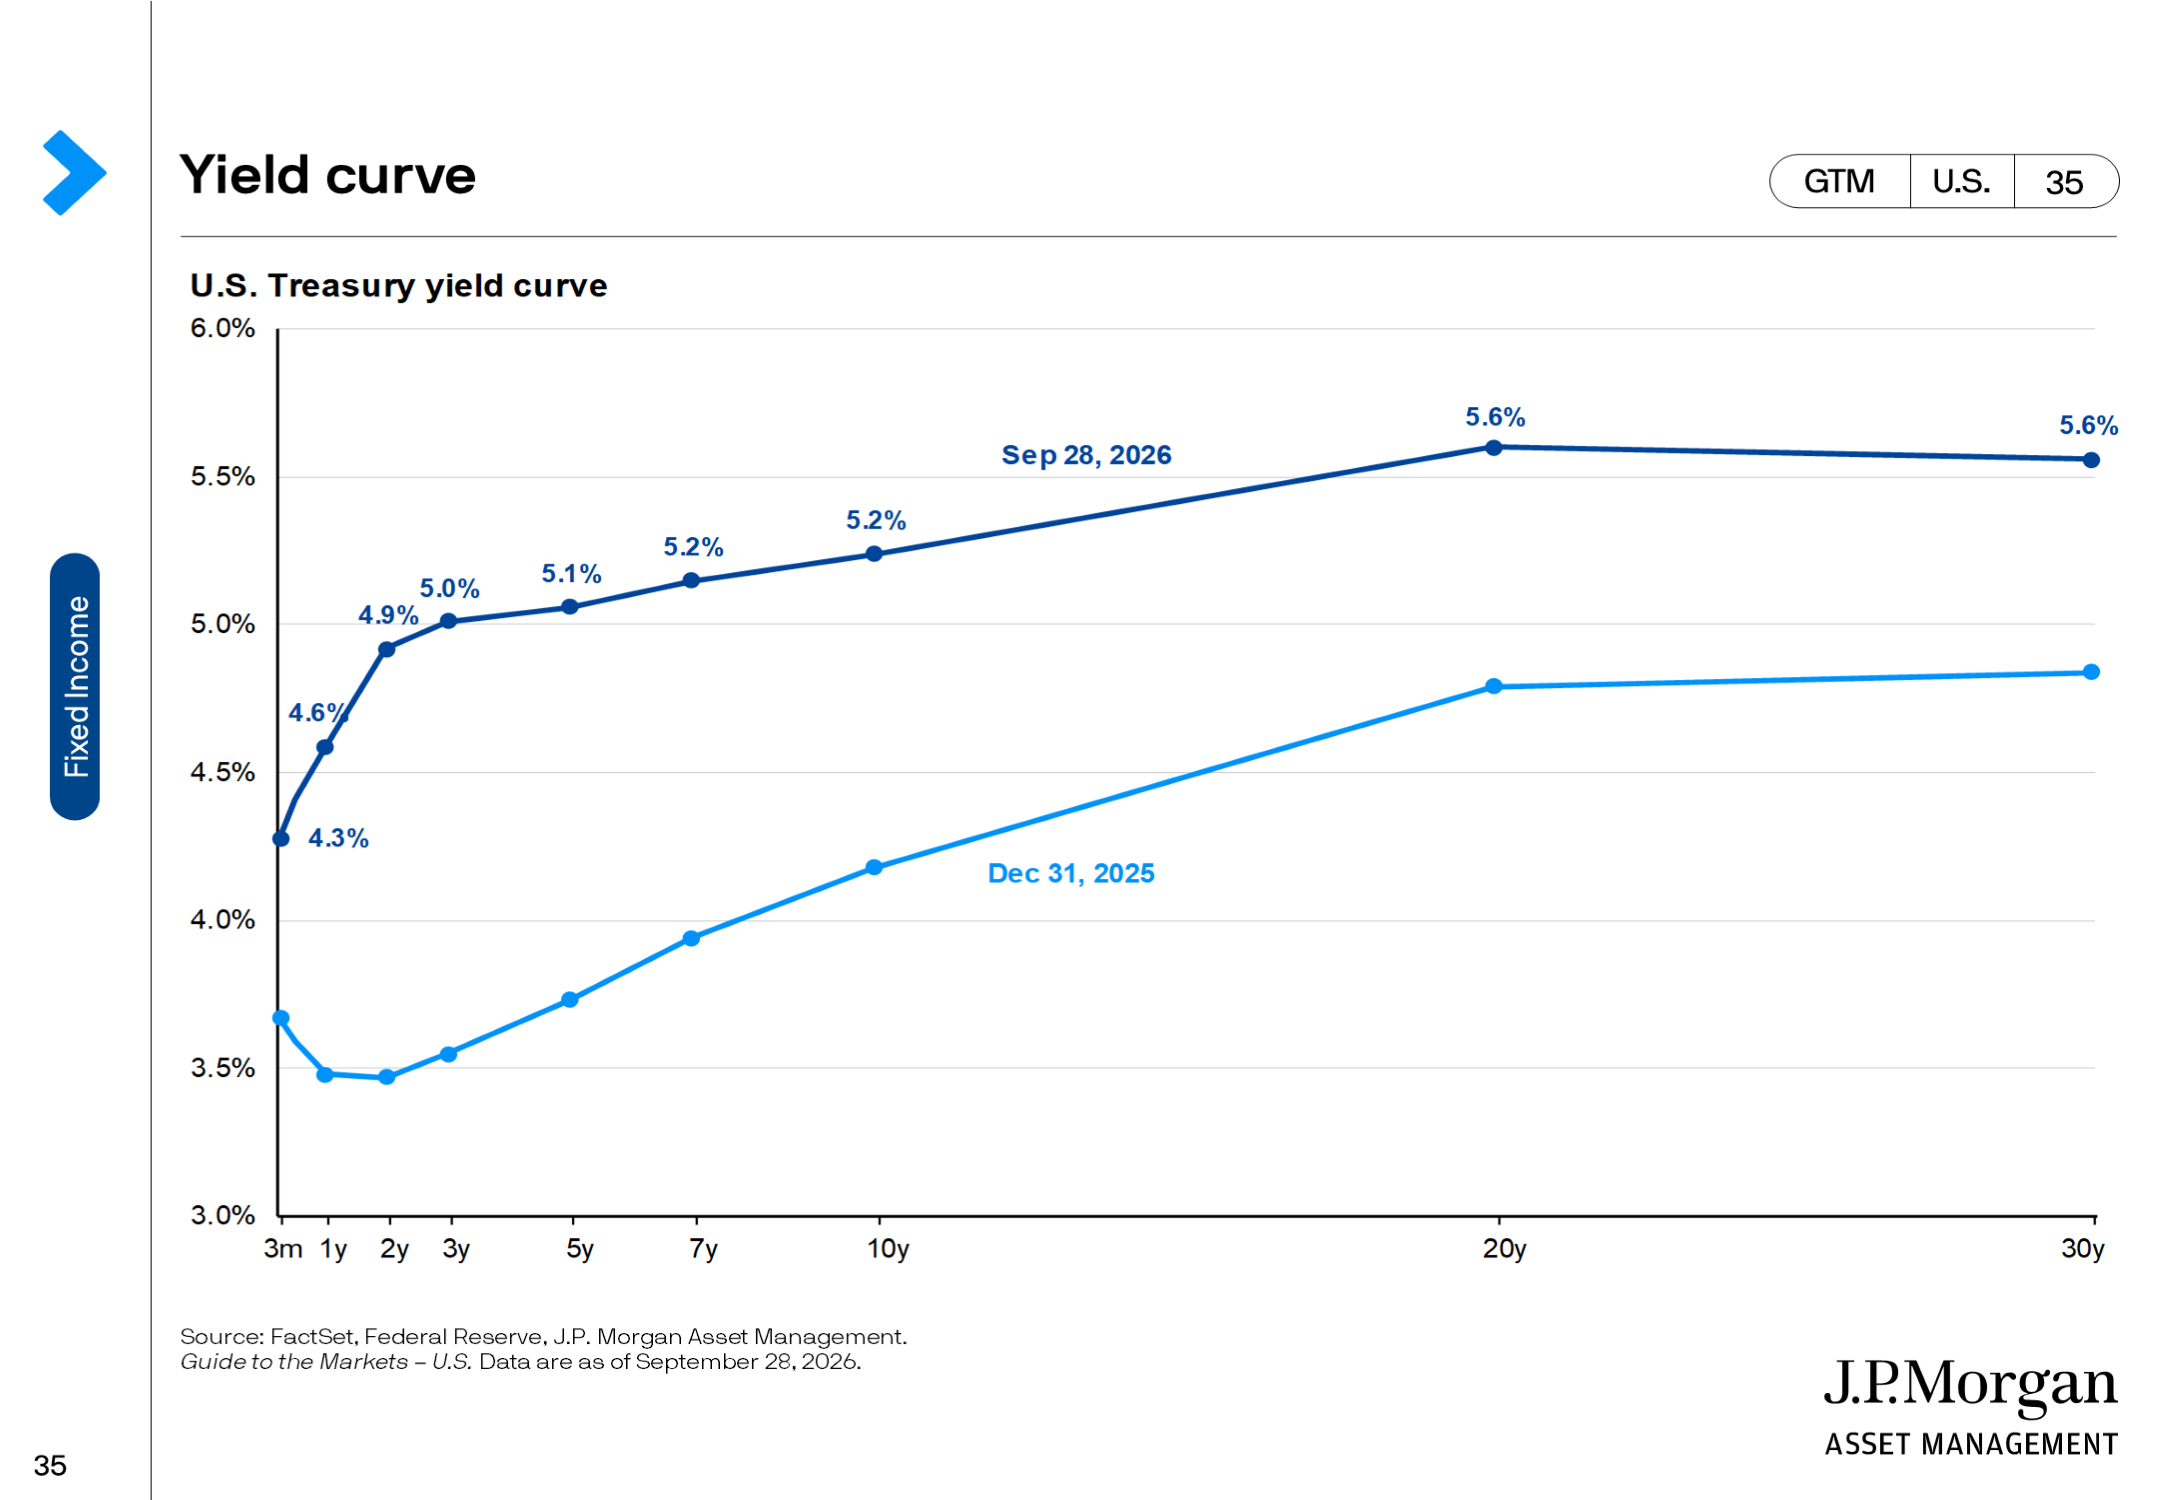
US Treasury yields have been steadily climbing all year, with the past month’s increase becoming much steeper. The 10-year yield is 5.30% today, even higher than it was just two days ago, and the highest it has been since about 2002. The sudden increase stems from a firmer confirmation from the Federal Reserve that inflation is expected to stick around, as well as the recent Fed funds rate increase. Much of the current pressure on inflation comes from heightened energy costs, so it remains to be seen how that may shake out and, in turn, how yields respond.
Bond Yields near 15-Year Highs
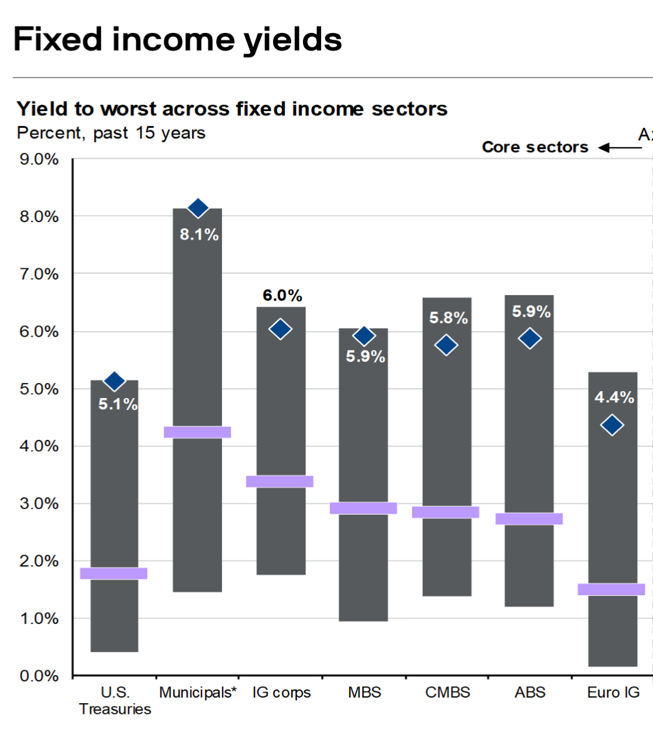
As the yield curve above has risen, so too have fixed income yields across the spectrum. Each of the gray bars below represents the 15-year range in yields for the various sectors. The purple bar is the 15-year median, and the blue diamond represents current yields. In every one of the core fixed income sectors below, yields are at or near the top of their 15-year range. Based on current market conditions (inflation, the Fed funds rate, and the yield curve), we expect this to hold true for a little while longer. These high yields could present an interesting opportunity to invest in fixed income.
Average Forward Returns for Bonds (Again)
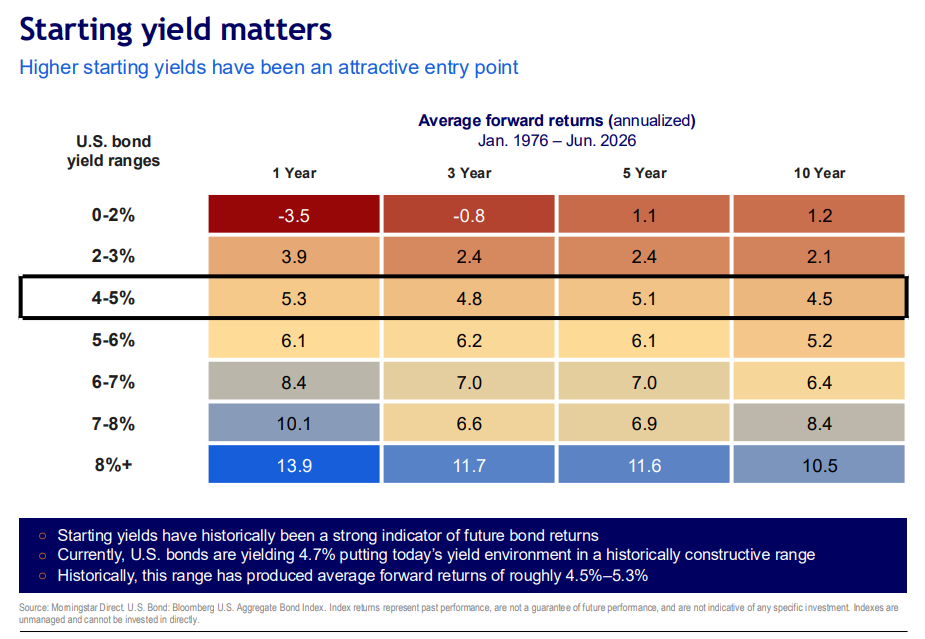
You’re probably getting some déjà vu looking at the chart below. I did use it just last month, so apologies for the repetition. The logic chain is worth repeating, though: US Treasury yields have risen significantly → core fixed income sector yields are at or near the top of their 15-year range → starting yield has been a solid predictor of forward returns in bonds.
Equity Asset Class Returns
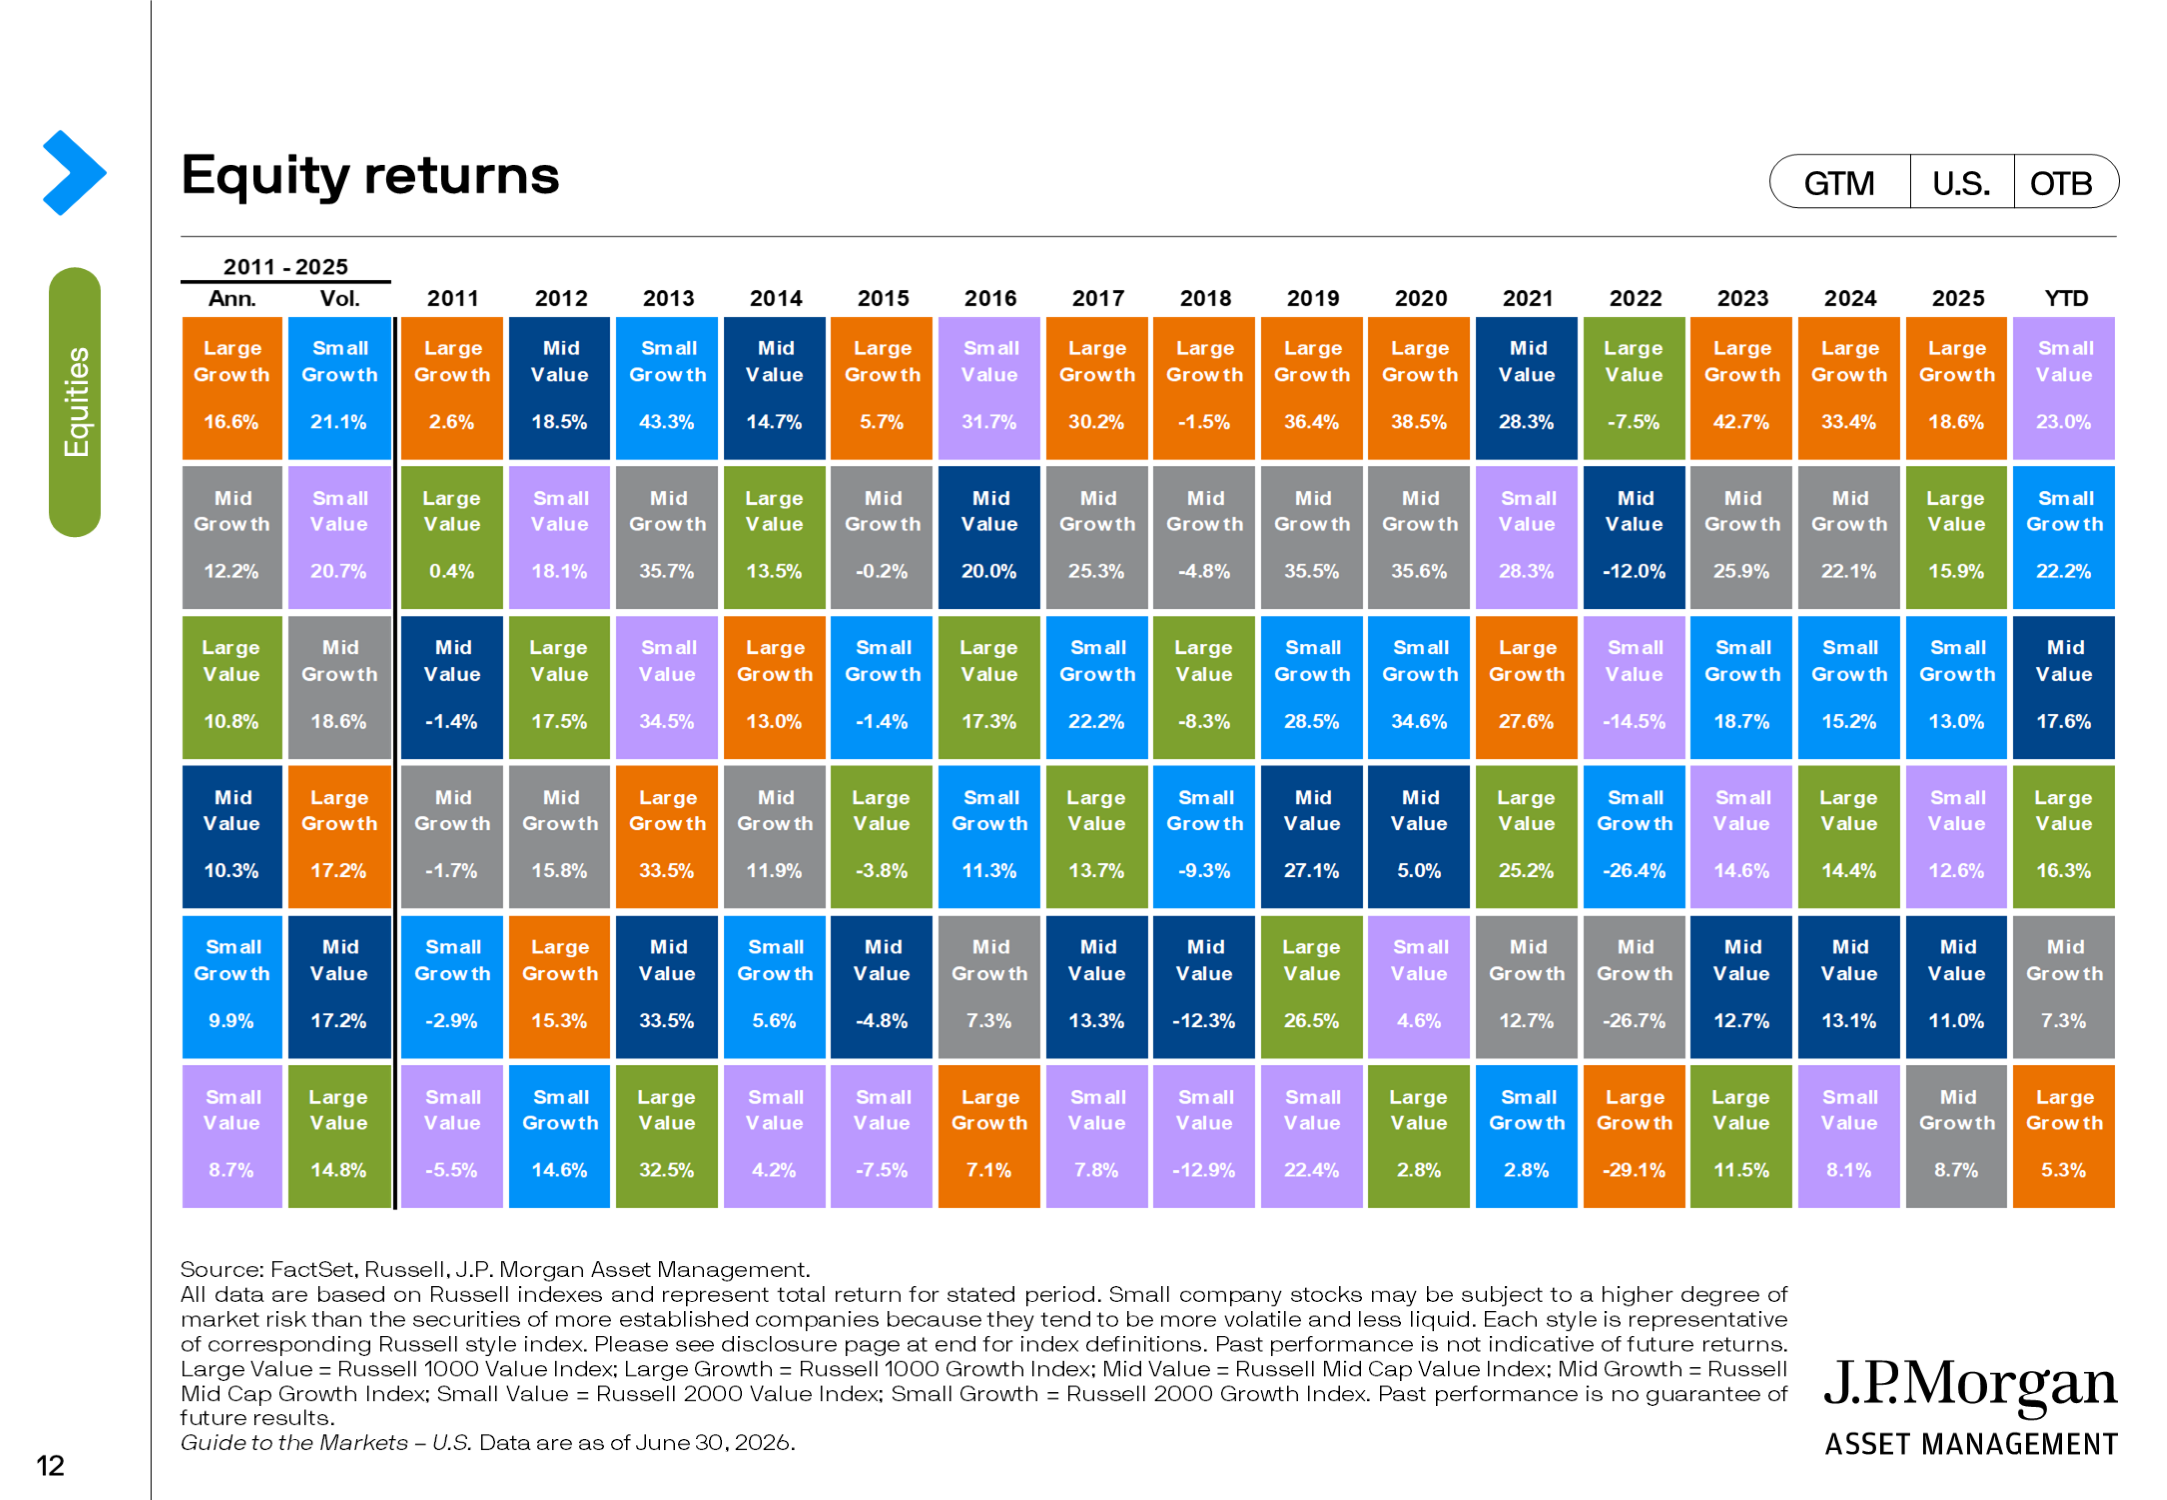
It may surprise some investors to learn the highly touted large growth stocks have posted the lowest year-to-date return among US equity categories. It has certainly paid to be invested in large growth over the past decade, but years like this emphasize the importance of diversification in a portfolio.
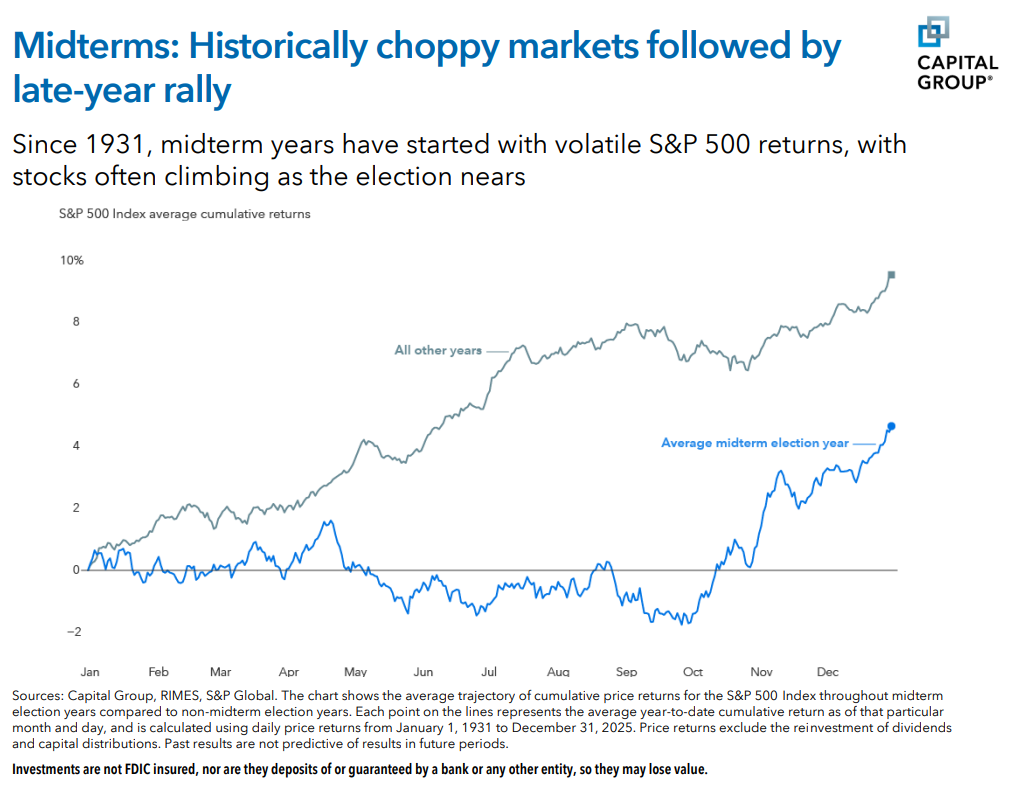
Average Market Return During Midterm Election Years
Midterm elections are quickly approaching, with commercials, phone calls, and texts coming through non-stop. The chart below clearly shows how the S&P 500 tends to be much more volatile early in the year before climbing more sharply as the election nears and ultimately passes. There’s always uncertainty in the market, but election years add another layer that can create more ups and downs. Remember, the chart below shows only the average since 1931. The S&P 500 is up 12% this year, and we don’t know what these elections may bring. Ultimately, staying invested is the most important part.
IMPORTANT DISCLOSURE INFORMATION: Please remember that past performance is no guarantee of future results. Different types of investments involve varying degrees of risk, and there can be no assurance that the future performance of any specific investment, investment strategy, or product (including the investments and/or investment strategies recommended or undertaken by PDS Planning, Inc. [“PDS”]), or any non-investment related content, made reference to directly or indirectly in this blog will be profitable, equal any corresponding indicated historical performance level(s), be suitable for your portfolio or individual situation, or prove successful. Due to various factors, including changing market conditions and/or applicable laws, the content may no longer be reflective of current opinions or positions. Moreover, you should not assume that any discussion or information contained in this blog serves as the receipt of, or as a substitute for, personalized investment advice from PDS. To the extent that a reader has any questions regarding the applicability of any specific issue discussed above to his/her individual situation, he/she is encouraged to consult with the professional advisor of his/her choosing. PDS is neither a law firm nor a certified public accounting firm and no portion of the blog content should be construed as legal or accounting advice. A copy of the PDS’ current written disclosure Brochure discussing our advisory services and fees is available for review upon request or at www.pdsplanning.com. Please Note: PDS does not make any representations or warranties as to the accuracy, timeliness, suitability, completeness, or relevance of any information prepared by any unaffiliated third party, whether linked to PDS’ web site or blog or incorporated herein, and takes no responsibility for any such content. All such information is provided solely for convenience purposes only and all users thereof should be guided accordingly. Please Remember: If you are a PDS client, please contact PDS, in writing, if there are any changes in your personal/financial situation or investment objectives for the purpose of reviewing/evaluating/revising our previous recommendations and/or services, or if you would like to impose, add, or to modify any reasonable restrictions to our investment advisory services. Unless, and until, you notify us, in writing, to the contrary, we shall continue to provide services as we do currently. Please Also Remember to advise us if you have not been receiving account statements (at least quarterly) from the account custodian.