

Welcome to our August 2026 Viewpoints, a monthly bulletin from PDS Planning to our valued clients and friends. Our goal with each issue of Viewpoints is to provide you with a wide variety of perspectives on life and wealth. Feel free to share with others.
Bond Performance: Coupon Return and Price Return
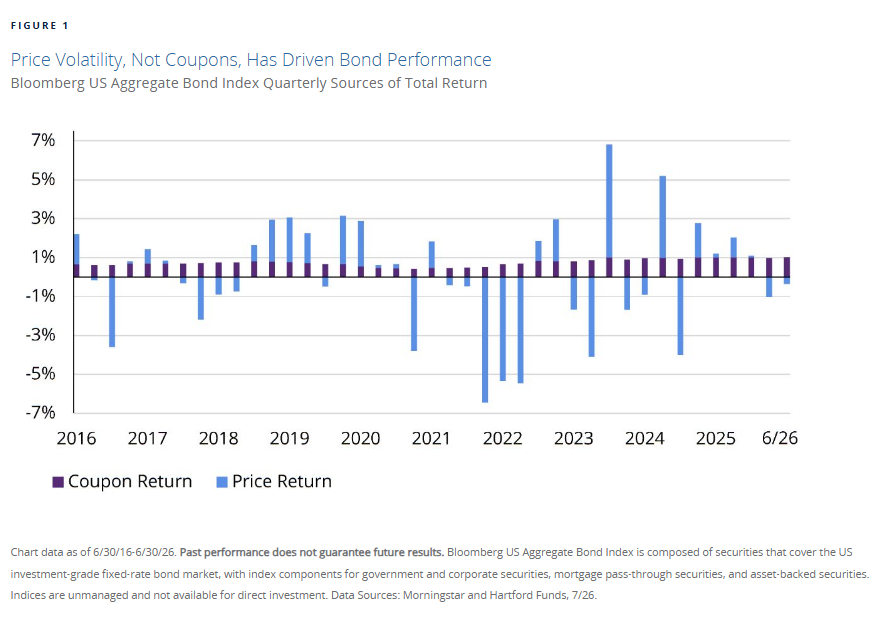
When investors think about bond performance, the coupon is usually what comes to mind first. That’s a fair assumption with an individual bond held to maturity, but bond funds are a different animal. Their total return comes from two sources, coupon return and price return. The chart below shows how each have contributed to the total return each quarter since 2016. Coupons have been understandably a steady contributor while the price return has been much more volatile.
As Hartford Funds put it, price swings have “far outweighed the contribution from coupons,” leaving fixed income with a more volatile return profile than a lot of investors expect walking in.
At PDS, we want clients’ bond allocations to behave like bonds. If there is equity volatility, we want the bond portion of the portfolio to be the ballast. That’s why we try to limit the price volatility on the bond side of the allocation. This chart can act as a good reminder of why duration and interest rate sensitivity matter so much when we build out the fixed income side of a portfolio.
Starting Yield and Bond Returns
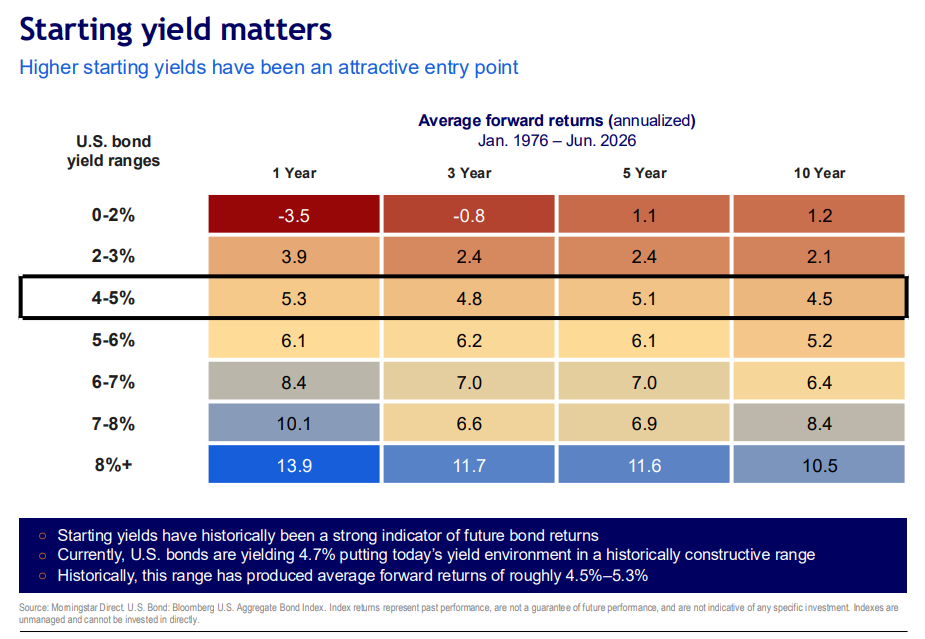
I’ve touched on this idea before, but the table below lays it out in a way that’s hard to argue with. Starting yield has historically been one of the better predictors of what bonds go on to return over the next several years. It’s not crystal ball, but the relationship has held up well over long stretches of history.
The outlined row shows where yields sit today, in the 4-5% range, with the columns to the right showing average forward returns going out 1, 3, 5, and 10 years from similar starting points. Looking back to 1976, that range has produced annualized forward returns of roughly 4.5% to 5.3%, a reasonably attractive setup compared to where yields sat for much of the last decade.
This pairs well with the volatility point from the chart above. Bonds have absolutely bounced around more than a lot of investors are used to. That may continue as the Fed/Inflation/Iran continue to evolve. We still believe they have their place in a portfolio, and not only for the return potential shown here. Bonds continue to play a role in cushioning a portfolio against stock market drawdowns, particularly when monitoring for duration and interest rate sensitivity, and that diversification benefit doesn’t show up in a table of historical yields.
The Mag 7 today
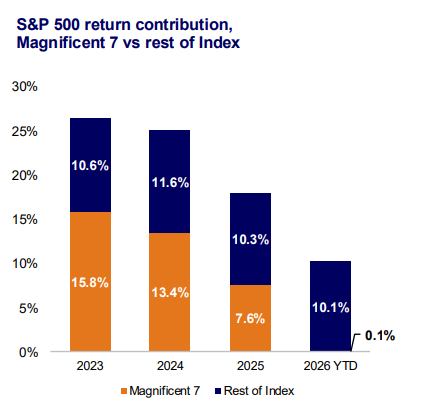
For a few years now, the Magnificent 7 have carried an outsized share of the S&P 500’s return. That’s been slowly changing, and 2026 is where it really shows up. The chart below breaks down how much of the index’s total return has come from those seven names versus everyone else, and this year the Magnificent 7 have contributed next to nothing.
On the positive side, this may be a sign of a healthier market. The rest of the index picking up more of the return means more companies may be participating, and leading, in this rally rather than a handful of mega-cap names doing the heavy lifting. That kind of broadening also has a side benefit as it naturally lessens how concentrated the investment is in the top 10 holdings.
The other side of it is worth asking about too. Does the fading contribution from the Magnificent 7 reflect investors growing more cautious on those companies’ future earnings, or is it simply other sectors catching up while the Mag 7 keep chugging along in the background? There’s no answer yet. Time will tell!

Mega IPOs in the Short Term
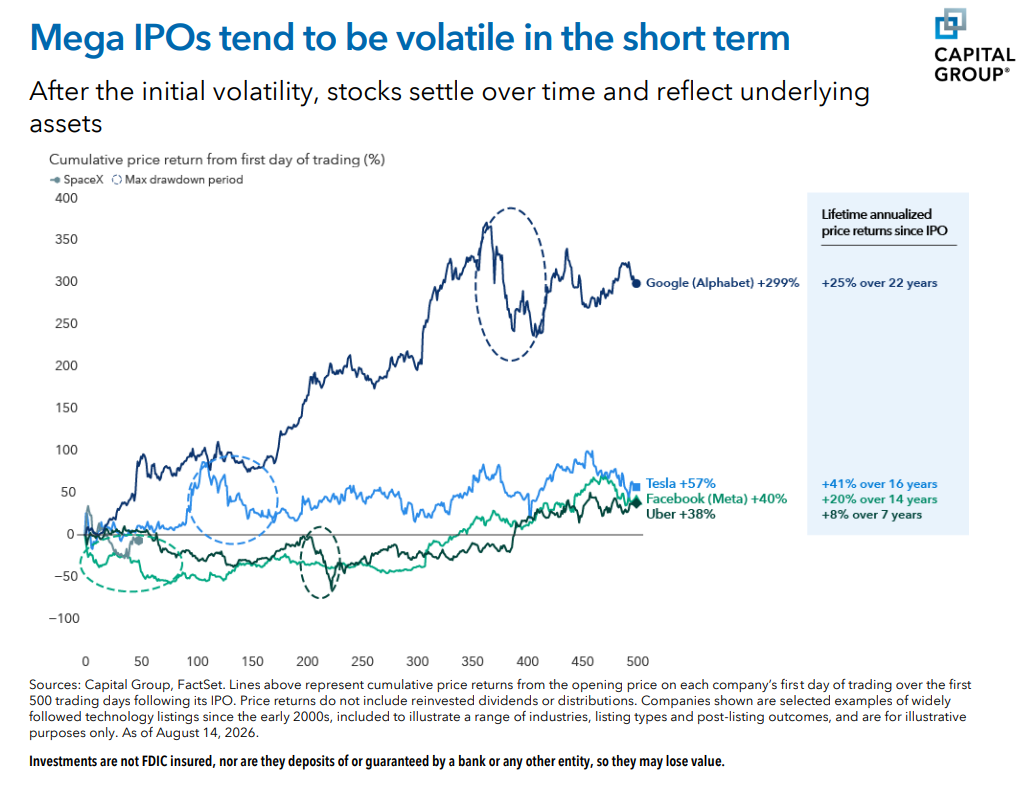
We’re in the middle of an IPO megacycle between SpaceX, OpenAI, Anthropic, and a handful of other high-profile names making their way to public markets. Retail and institutional investors alike are showing up with plenty of excitement. Setting the hype aside, how should investors think about deals like these?
The chart below looks at some of the largest U.S.-listed IPOs going back to 2004, tracking price performance over their first 500 trading days. After the initial pop, plenty of these stocks went on to struggle for weeks or months afterward before eventually settling and tracking closer to the underlying business’s actual earnings power.
It’s a good real-world example of Ben Graham’s old line that the market behaves like a voting machine in the short run and a weighing machine over the long run. At PDS, our approach stays the same either way. We focus on what we can control, fees and taxes, and keep things simple with ETFs and index funds for broad diversification, rather than chasing headlines or making concentrated bets on any single stock, IPO or otherwise.
IMPORTANT DISCLOSURE INFORMATION: Please remember that past performance is no guarantee of future results. Different types of investments involve varying degrees of risk, and there can be no assurance that the future performance of any specific investment, investment strategy, or product (including the investments and/or investment strategies recommended or undertaken by PDS Planning, Inc. [“PDS”]), or any non-investment related content, made reference to directly or indirectly in this blog will be profitable, equal any corresponding indicated historical performance level(s), be suitable for your portfolio or individual situation, or prove successful. Due to various factors, including changing market conditions and/or applicable laws, the content may no longer be reflective of current opinions or positions. Moreover, you should not assume that any discussion or information contained in this blog serves as the receipt of, or as a substitute for, personalized investment advice from PDS. To the extent that a reader has any questions regarding the applicability of any specific issue discussed above to his/her individual situation, he/she is encouraged to consult with the professional advisor of his/her choosing. PDS is neither a law firm nor a certified public accounting firm and no portion of the blog content should be construed as legal or accounting advice. A copy of the PDS’ current written disclosure Brochure discussing our advisory services and fees is available for review upon request or at www.pdsplanning.com. Please Note: PDS does not make any representations or warranties as to the accuracy, timeliness, suitability, completeness, or relevance of any information prepared by any unaffiliated third party, whether linked to PDS’ web site or blog or incorporated herein, and takes no responsibility for any such content. All such information is provided solely for convenience purposes only and all users thereof should be guided accordingly. Please Remember: If you are a PDS client, please contact PDS, in writing, if there are any changes in your personal/financial situation or investment objectives for the purpose of reviewing/evaluating/revising our previous recommendations and/or services, or if you would like to impose, add, or to modify any reasonable restrictions to our investment advisory services. Unless, and until, you notify us, in writing, to the contrary, we shall continue to provide services as we do currently. Please Also Remember to advise us if you have not been receiving account statements (at least quarterly) from the account custodian.