Historical Stock Market Returns
As we approach the halfway mark of 2020, it’s hard to believe the stock market (S&P 500) is down only 7% year to date. We saw a run of 5% through the first almost two months before entering the quickest bear market in history. From the market peak in February to the bottom in March, we witnessed a decline of 34% in just 23 trading days. During which time the US and Global economy effectively shut down due to the Coronavirus. In the proceeding months, the S&P 500 rose 45% before settling up 35% from the bottom. In summary, down 7% year to date.
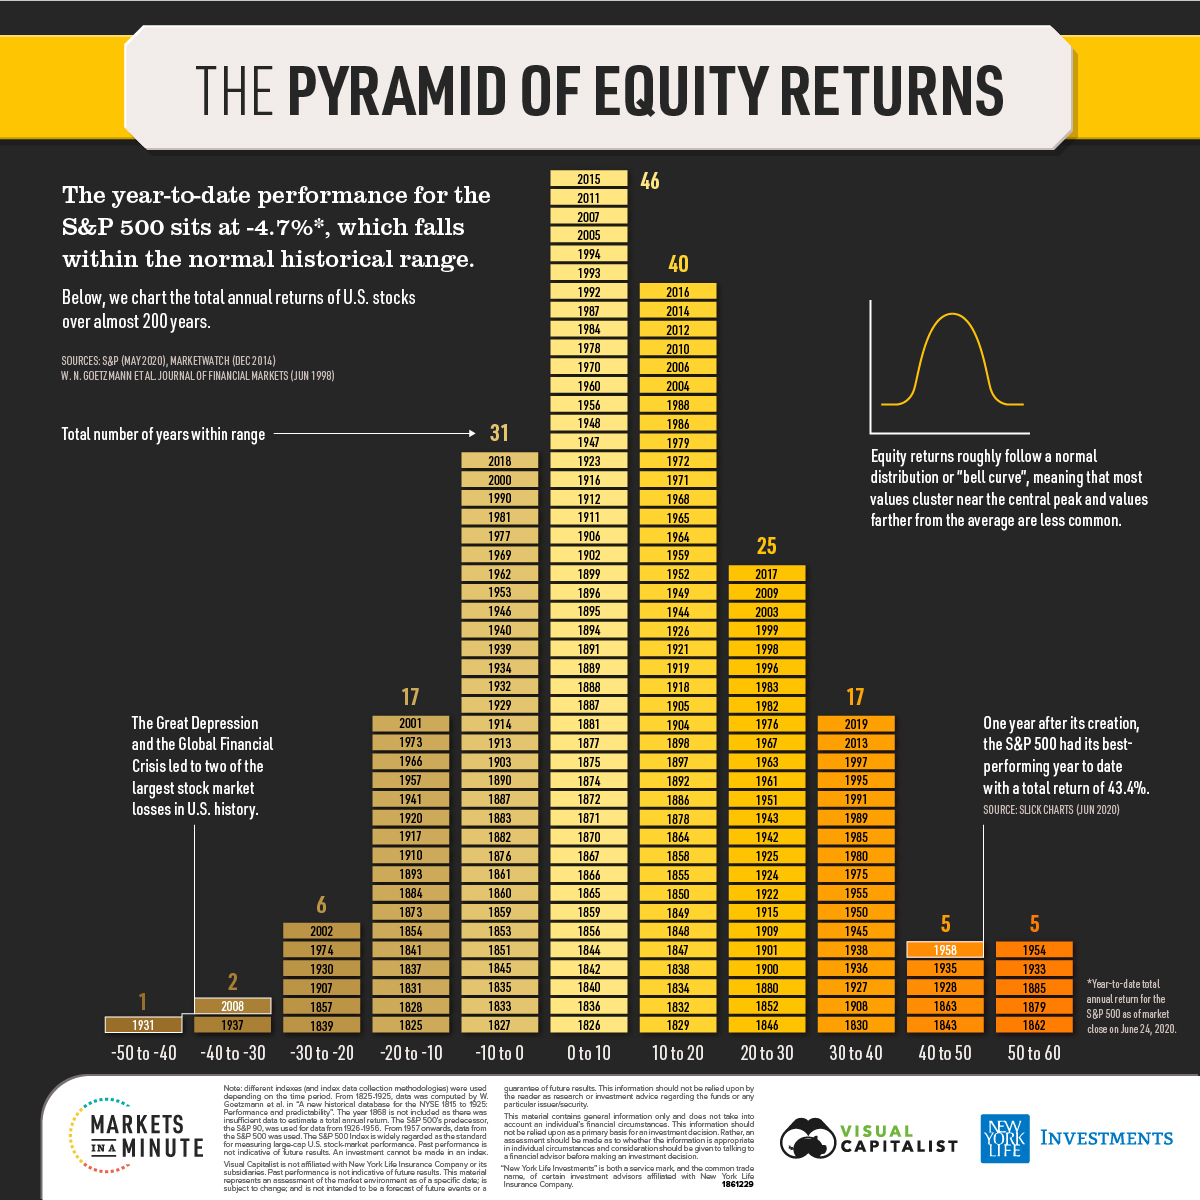
After everything that happened in the first half of 2020 the market return is still in the “normal” range. Using the above graphic from Visual Capitalist as reference, the annual returns of the S&P 500 follow a bell curve with a skew towards the positive. Dating back to 1825, almost 60% of annual returns have fallen between -10% and 10%.
Large market declines don’t happen as often as gains, but they tend to stay relevant in our minds (see loss aversion). The Great Depression (1931) and the Global Financial Crisis (2008) led to two of the largest stock market losses in history. And while volatility is prevalent today, extreme volatility over extended periods of time is less common. Only 10 out of 195 years have had 40%+ returns and we haven’t seen one since 1958. Two of those years were bounce backs from The Great Depression, one was the year before The Great Depression, and five were in the 1800s.
What Does It Mean?
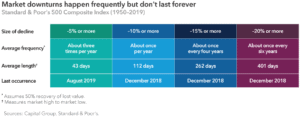
Market downturns are common, normal, expected, inevitable, even. Using history as a guide, the markets see a 10% decline once per year and a bear market every 6 years. Each time, we have come out and reached new market highs.
The most important thing is to remain invested and not try to time the market. Over shorter periods of time, investment returns and volatility can vary widely; however, long-term investors are rewarded for their time in the market, not for trying to time the market. Maintaining a diversified allocation that is consistent with your long-term goals, combined with periodic rebalancing, has consistently resulted in beneficial long-term financial outcomes. We remind clients to keep their next 7-12 years of anticipated cash distribution needs in stable assets such as cash, CDs, and short-term bonds.
Please remember that past performance may not be indicative of future results. Different types of investments involve varying degrees of risk, and there can be no assurance that any specific investment, strategy, or product or any non-investment related content, made reference to directly or indirectly in this newsletter, will be suitable for your individual situation, or prove successful. This material is distributed by PDS Planning, Inc. and is for information purposes only. Although information has been obtained from and is based upon sources PDS Planning believes to be reliable, we do not guarantee its accuracy. It is provided with the understanding that no fiduciary relationship exists because of this report. Opinions expressed in this report are not necessarily the opinions of PDS Planning and are subject to change without notice. PDS Planning assumes no liability for the interpretation or use of this report. Consultation with a qualified investment advisor is recommended prior to executing any investment strategy. No portion of this publication should be construed as legal or accounting advice. If you are a client of PDS Planning, please remember to contact PDS Planning, Inc., in writing, if there are any changes in your personal/financial situation or investment objectives. All rights reserved.