Economic and Investment News Bits
- “It’s the fourth time in the last 80 years that we’ve seen a big surge of oil come into the market, and every time you have weak prices. It happened in the late 1950s when Saudi Arabia production came on. Actually, back in 1931 when oil went to 10 cents a barrel, and if you pulled into a gas station, they’d give you a free chicken as a premium to try and get business. So every time the market has come back and stabilized,” (Source: Daniel Yergin, IHS Cambridge Energy Research).
- Early diagnosis for diseases such as Alzheimer’s and heart disease could eventually come in the form of a few drops of blood from a finger. Fluidic Analytics, a company based in London, is developing what it terms “protein fingerprints” of illness. The process analyzes a person’s blood proteins, as proteins manage the structure of a cell and can signal if there are potential problems in how the cell is functioning. More information is needed because how a protein functions varies depending on chemical structure, composition and electrical charge. The company plans to develop its first product, marketed toward doctors and hospitals, for patient testing. The equipment used to administer the test would be comprised of a reader and disposable chip. (Source: Financial Times)
- Deutsche Bank believes the markets are underestimating Europe’s economic progress, Greece notwithstanding. Economic reforms in Portugal, Spain, Italy, and Ireland, combined with lower oil, a lower euro, QE, and a solid U.S. recovery says Europe may end up doing a lot better than expected.
- Technology stocks represented 34.5% of the S&P 500 market cap on March 24, 2000. This was the date of the index’s peak before the dot-com bubble burst. Today, technology stocks represent 19.7% of the S&P 500 market cap. (Source: Standard & Poor’s)
- Six of the top-20 largest cities in the U.S. are in Texas: Houston, San Antonio, Dallas, Austin, Ft. Worth, and El Paso. California has three: Los Angeles, San Diego, and San Francisco. Columbus is the 15th largest city and the only one in Ohio in the top 20. (Source: U.S. Census Bureau)
Thought for the week
“Coming together is a beginning; keeping together is progress; working together is success.”
Henry Ford, American businessman (1863-1947)
Wealth Idea for the Week
Investors often establish a maximum one-year loss tolerance for themselves. The number might be 5%, or it might be 20%, but often this number is chosen without considering how a portfolio allocation really determines what the loss might be. For example, let’s assume a maximum one-year loss tolerance of 10%. Let’s also assume a conservative mix of 50% bonds and 50% stocks. The worst return for the S&P 500 Index over the last 10 years was 2008’s loss of 37%. That same year, bonds gained about 5%. It’s pretty easy to see that the conservative 50/50 allocation is suddenly not very conservative. The overall return in 2008 would have been a loss of 16%, which exceeded the investor’s maximum draw-down by more than 50%. This lesson is important not just for establishing risk tolerance, but also for understanding market movements: seldom do all asset classes move together. To achieve the 2014 S&P 500 Index’ return of 13%, it would have taken a very aggressive allocation, far exceeding the loss tolerance for most investors. Understanding both return and risk potential is vital to creating an accurate allocation for long-term investing.
Graph of the Week (CLICK TO ENLARGE)
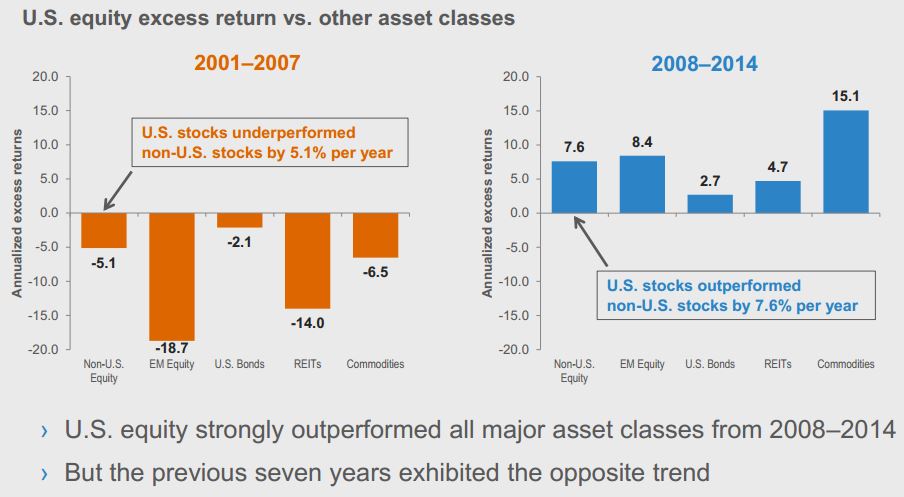
As you have heard from us before, large cap U.S. stocks significantly outperformed almost all other asset classes last year. This chart from Russell Investments shows how this dynamic has changed over the past 15 years. From 2001 to 2007, U.S. stocks underperformed international stocks by about 5.1% per year and emerging market stocks by almost 19%. However, recent years have favored domestic stocks. This is a great visual to remind us that diversification has helped to weather the swings in asset class performance.
This material is distributed by PDS Planning, Inc. and is for information purposes only. Although information has been obtained from and is based upon sources PDS Planning believes to be reliable, we do not guarantee its accuracy. It is provided with the understanding that no fiduciary relationship exists because of this report. Opinions expressed in this report are not necessarily the opinions of PDS Planning and are subject to change without notice. PDS Planning assumes no liability for the interpretation or use of this report. Investment conclusions and strategies suggested in this report may not be suitable for all investors and consultation with a qualified investment advisor is recommended prior to executing any investment strategy. All rights reserved.