
Viewpoints: April 2020
Welcome to Viewpoints, a monthly bulletin from PDS Planning to our valued clients and friends. Our goal with each issue of Viewpoints is to provide you with a wide variety of perspectives on life and wealth. Feel free to share with others.
Economic and Investment News Bits
- Tech Titans: The top 5 stocks in the S&P 500 (Microsoft, Apple, Amazon, Google parent Alphabet, and Facebook) currently account for 20%+ of the entire index…which is a is a greater concentration of the top 5 stocks than during the dotcom bubble. (Source: Reuters)
- How Low Can They Go?: 10-year Treasury bonds are currently yielding around 0.60%, or less than one-tenth of their historical average since 1962 (6.09%). Just one year ago, 10-year Treasury bonds were yielding over 4 times as much as today (around 2.5%) (Source: yCharts)
- Waffle House Index Update: Waffle House is known for being open 24/7. During emergency events, the “Waffle House Index” is an informal barometer of the severity of a crisis. Previously, this index has only been used to gauge weather-related impacts. For example, in October 2018, Hurricane Michael caused the index to make headlines when 30 restaurants were closed. Due to the COVID-19 pandemic, 429 restaurants (over 20% of their total locations) are closed as of Waffle House’s most recent announcement, highlighting the tremendous impacts of this disease. (Source: Waffle House)
- Missing Professional Sports: The Ottawa Senators vs. L.A. Kings NHL Hockey game on March 11th was the most recent professional sports game in the United States. The last time there were no games in the four major sports in the month of April was 1883. As a point of reference, the U.S. President at the time was Chester A. Arthur, the 21st president. (Sources: Adam Schefter, Elias Sports Bureau)
- See You at the Drive-In: With social distancing recommendations likely to remain in effect for the foreseeable future, drive-in movie theaters are experiencing a resurgence. At the industry’s peak in 1958, there were 4,063 drive-in screens across the country. Today, there are only 549 screens in the entire U.S. (Source: L.A. Times)
Thought for the Month
“Nothing in life is to be feared, it is only to be understood. Now is the time to understand more, so that we may fear less.”
– Marie Curie, Polish-French physicist and first person to win two Nobel Prizes, (1867-1934)
Commentary – “The Cost-of-Thriving Index”
The Manhattan Institute published a report titled “The Cost-of-Thriving Index: Reevaluating the Prosperity of the American Family”. The study proposes that government statistics on inflation do not truly reflect an average family’s ability to live a prosperous life. Instead, being able to afford four middle-class basics (housing, health care, college education, and owning a car) represent a more accurate measure of financial well-being. In 1985, a typical working man could pay for these basics after 30 weeks of work. Today, a typical working man now needs 53 weeks of income (aka. over a year) to pay for one year of middle-class basics, meaning a typical family cannot survive on a single worker’s income. It’s even worse for the average woman who now requires 66 weeks of income to pay for a year’s worth of basics.
Truly eye-opening statistics, especially considering this study was conducted while the economy was booming, the stock market was setting record highs, and unemployment was at extreme lows. Something to keep in mind when hearing analysis from economists, financial markets “experts”, and politicians that may not consider this more practical “Cost-of-Thriving Index” that more directly applies to average, hard-working Americans.
Chart for the Month – Tech Titans continued
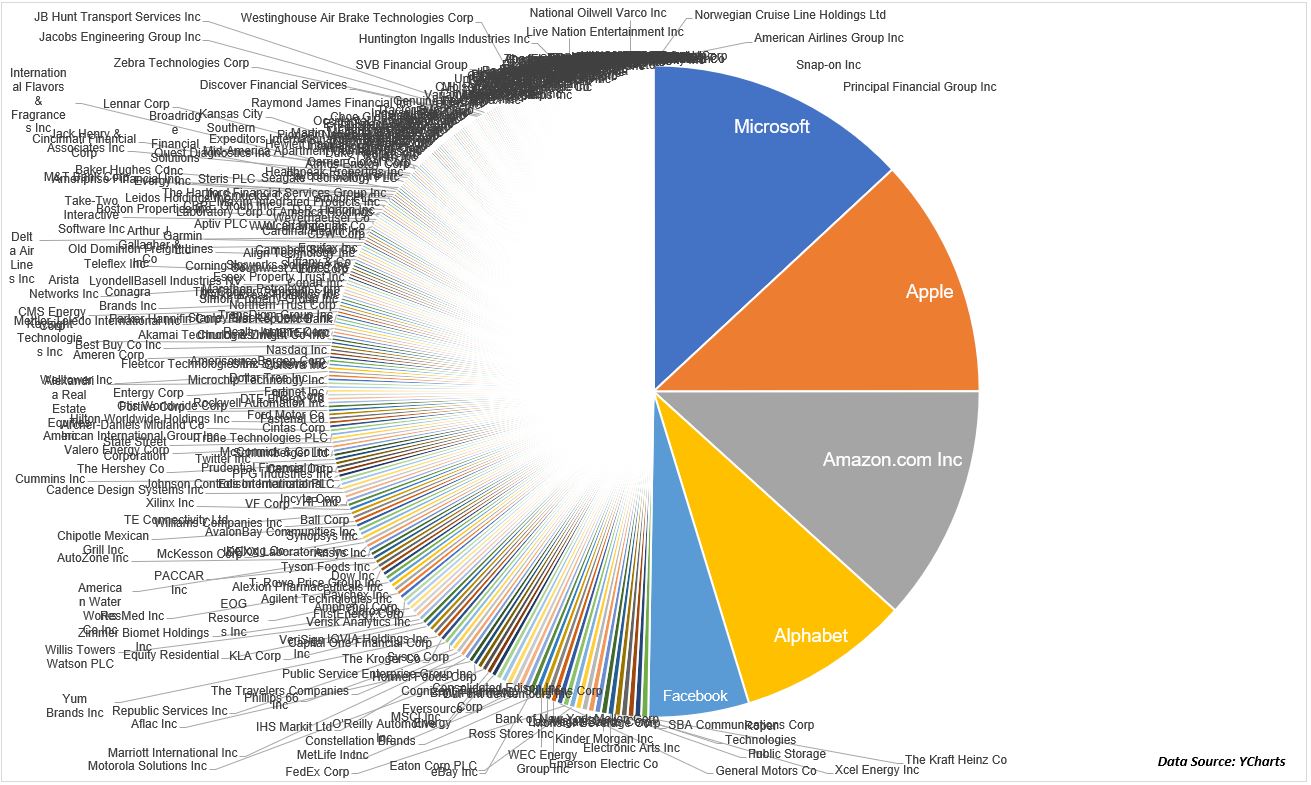
As mentioned in the first tidbit in this edition of Viewpoints, the concentration of the 5 largest stocks in the S&P 500 are the greatest since the tech bubble. On his blog, Michael Batnick, CFA, shares some interesting insights into the current market environment. The above chart shows how the market value of these same 5 stocks equals the combined market value of the bottom 350 stocks of the index (hence the intentionally convoluted left half of the above pie chart). This is up from the top 5 equaling the bottom 282 in July of 2018 (68 fewer stocks), showing the ongoing index consolidation into these 5 large technology companies.
Please remember that past performance may not be indicative of future results. Different types of investments involve varying degrees of risk, and there can be no assurance that any specific investment, strategy, or product or any non-investment related content, made reference to directly or indirectly in this newsletter, will be suitable for your individual situation, or prove successful. This material is distributed by PDS Planning, Inc. and is for information purposes only. Although information has been obtained from and is based upon sources PDS Planning believes to be reliable, we do not guarantee its accuracy. It is provided with the understanding that no fiduciary relationship exists because of this report. Opinions expressed in this report are not necessarily the opinions of PDS Planning and are subject to change without notice. PDS Planning assumes no liability for the interpretation or use of this report. Consultation with a qualified investment advisor is recommended prior to executing any investment strategy. No portion of this publication should be construed as legal or accounting advice. If you are a client of PDS Planning, please remember to contact PDS Planning, Inc., in writing, if there are any changes in your personal/financial situation or investment objectives. All rights reserved.