
Bear Markets & Bull Markets
Rather than emotionally reacting to headlines which tend to vacillate between extremes, we feel it is important to provide unbiased, factual information to provide historical context and allow us all the mindset to make informed, rational decisions.
Longest Bull, Quickest Bear
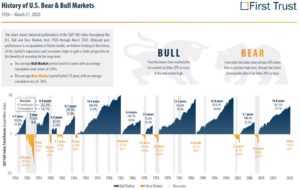
We recently experienced the longest bull market in history followed by the quickest turn to a bear market in history. The combination of these two unprecedented events seems to fit our current narrative of heightened volatility caused by ongoing uncertainty due to the coronavirus pandemic. To try and make sense of what this all means, it is important to have a better understanding of the terms bull market and bear market:
Bull Market: A long-term trend of upward price movement in a stock index (i.e. the S&P 500), usually confirmed once values are up 20% from previous market lows. This generally means the economy is strong, unemployment is low, and stock prices are expected to continue their upward trend.
Bear Market: A downward (usually long-term) trend in market prices, typically deemed a bear market when values have fallen 20% from previous market highs. Usually, the economy is slowing, unemployment is increasing, and stock prices are expected to continue decreasing. Bear markets are not the same as an economic recession.
Historical Context
How the data is measured and analyzed has a sizable impact on the quantitative conclusions, but the qualitative takeaways tend to be similar. For example, whether the Dow Jones 30 or S&P 500 are measured, over what timeframe, and whether or not dividends are assumed to be reinvested.
Historically, bull and bear markets take months to form, with bull markets lasting an average of 6.6 years and bear markets lasting an average of 1.3 years. Reviewing the chart below from First Trust, the current bear market is the twelfth since 1926, and the third over the last 20 years (Tech Bubble, Financial Crisis, and current).
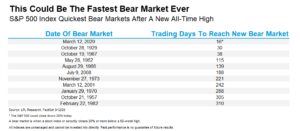
The swiftness of our current retreat into bear market territory is the fastest in history. On average, it has taken 172 days (5.5 months) for market prices to fall the requisite 20%. This time, it took a mere 16 days, a full 2 weeks faster than during the Great Depression.
Market Rebound
In recent weeks, the S&P 500 Index has rallied back, including a +7% return today alone (4/6/2020). Past performance is not an indication of future returns, but we should use the past to inform us about potential outcomes. The table below looks at all bear markets since 1957. The average bear market peak to trough return is -35.8% (a number we nearly reached a few short weeks ago when the markets were down -34.8% from their all-time highs). Furthermore, the average market bounce during the bear market is 14.5% (as of today, we are 20.5% above the recent market bottom…or technically back into bull market territory).
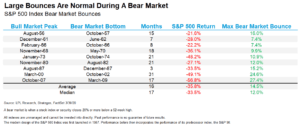
Does this mean the bear market is over? The fastest bear market followed by the fastest bull market? Using the Financial Crisis of 2008-2009 for context, during that time when the S&P 500 lost -56% peak to trough, stocks bounced more than 10% three times, with a huge 27% rally in late-2008. As you may recall, the market later faltered and reached its eventual bottom a few months later in March 2009. In other words, large positive market bounces are quite normal, especially during bear markets.
Conclusion
Whether the next bull market has already started or this is merely a bear market bounce, we recommend maintaining discipline using periodic rebalancing combined with a diversified allocation that is consistent with your long-term goals. We remind clients to keep their next 7-12 years of anticipated cash distribution needs in stable assets such as cash, CDs, and short-term bonds. These tumultuous times and never-ending stream of news coverage are a stark reminder that today’s headlines and tomorrow’s reality are seldom the same.
Please remember that past performance may not be indicative of future results. Different types of investments involve varying degrees of risk, and there can be no assurance that any specific investment, strategy, or product or any non-investment related content, made reference to directly or indirectly in this newsletter, will be suitable for your individual situation, or prove successful. This material is distributed by PDS Planning, Inc. and is for information purposes only. Although information has been obtained from and is based upon sources PDS Planning believes to be reliable, we do not guarantee its accuracy. It is provided with the understanding that no fiduciary relationship exists because of this report. Opinions expressed in this report are not necessarily the opinions of PDS Planning and are subject to change without notice. PDS Planning assumes no liability for the interpretation or use of this report. Consultation with a qualified investment advisor is recommended prior to executing any investment strategy. No portion of this publication should be construed as legal or accounting advice. If you are a client of PDS Planning, please remember to contact PDS Planning, Inc., in writing, if there are any changes in your personal/financial situation or investment objectives. All rights reserved.